S&P 500 ETF Long Setup — 1H Chart
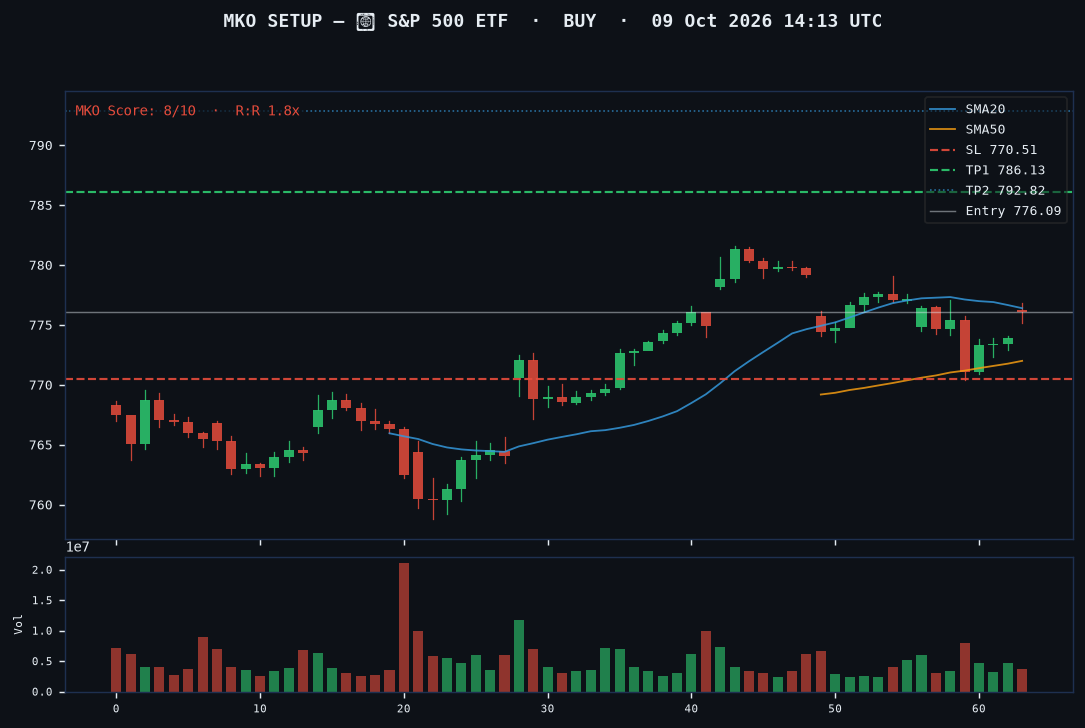
LongScore 8/10 · STRONG CONVICTION
Setup levels
| Level | Price | |
|---|---|---|
| Entry (price at publication) | 776.09 | |
| Stop / invalidation | 770.51 | risk 5.58 |
| Target | 786.13 | reward 10.04 |
| Risk / reward | 1:1.8 |
Market state
| Factor | Reading |
|---|---|
| Trend | Bullish Continuation |
| Momentum | Declining |
| Volatility | Low |
| Sentiment | Risk-ON |
Analysis
S&P 500 presents a compelling long setup with an 8/10 signal score underpinned by coherent technical confluence. Price at 776.09 sits above the Ichimoku cloud with bullish cloud structure (AB), while EMA20 above EMA50 confirms uptrend mechanics. VWAP at 769.82 sits meaningfully below current price, validating the institutional buying zone thesis. The trade targets a 1.8 risk-reward ratio to 786.13, with extended resistance at 792.82.
However, several headwinds merit attention. RSI at 42.7 shows room before overbought conditions, yet MACD histogram remains negative at -0.57, suggesting momentum has not fully rotated bullish. Volume Profile reveals price trading outside the value area above the POC at 769.06, which can indicate extended positioning. Order flow delta shows net sell aggression, a structural warning sign that despite technicals, institutional selling pressure persists.
The stop at 770.51 provides rational risk management through the VAL floor at 760.31. With no macro events scheduled over the next 24 hours, this setup carries purely technical merit. Invalidation occurs below the EMA50 support level or if order flow aggression persists without reversal confirmation.
Chart
How to use this setup. A setup is a study of where the engine sees a favourable risk/reward, not a call to trade. Check the current price and structure first: the daily technical analysis shows live levels, and the dashboard a 15-minute read.
Other S&P 500 ETF setups
| 13 Oct 2026 | Long | 1H |
| 12 Oct 2026 | Long | 1H |