Home › Trade Setups › S&P 500 ETF
S&P 500 ETF Long Setup — 1H Chart
Published 13 Oct 2026 16:38 UTC · SPY · source: XenosFinance MKO
Historical setup — levels refer to the publication time and are not updated.
LongScore 7/10 · HIGH PROBABILITY
Setup levels
| Level | Price | |
|---|---|---|
| Entry (price at publication) | 777.59 | |
| Stop / invalidation | 774.88 | risk 2.71 |
| Target | 782.47 | reward 4.88 |
| Risk / reward | 1:1.8 |
Market state
| Factor | Reading |
|---|---|
| Trend | Bullish Continuation |
| Momentum | Declining |
| Volatility | Low |
| Sentiment | Risk-ON |
Analysis
Price sits 0.4 ATR above EMA20 at 777.59, between the POC at 777.43 and VAH at 780.10, positioning above the swing low of 770.43 with room to the swing high of 779.42—ideal for a long push. Rally must clear the Bollinger mid-band at 777.31 and reclaim 779.42 to confirm Target 1 at 782.47 without rolling over. A break below 774.88 invalidates, as does a CPI miss on Wednesday at 12:30 UTC with Core CPI y/y expected at 2.5%, which could trigger fresh selling pressure.
Chart
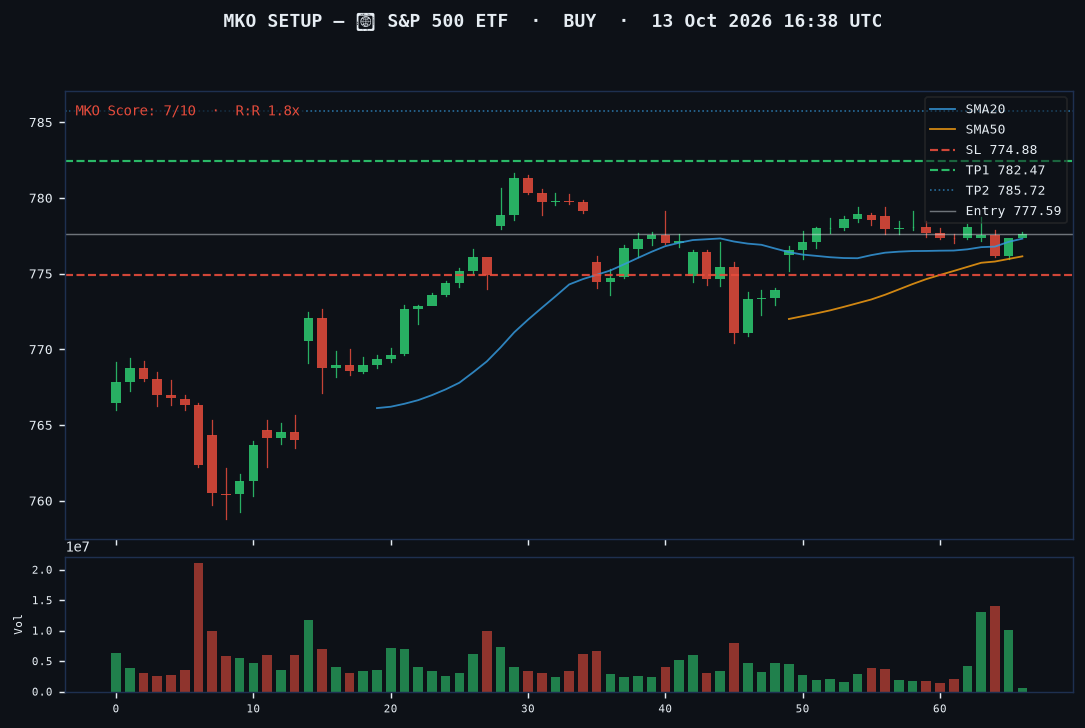
How to use this setup. A setup is a study of where the engine sees a favourable risk/reward, not a call to trade. Check the current price and structure first: the daily technical analysis shows live levels, and the dashboard a 15-minute read.
Other S&P 500 ETF setups
| 12 Oct 2026 | Long | 1H |
| 09 Oct 2026 | Long | 1H |
Educational content only. Trade setups are produced by the XenosFinance engine from public market data for market analysis and trading education. They are not investment advice or a recommendation to buy or sell any financial instrument; levels refer to the time of publication and are not updated afterwards. Trading involves a significant risk of loss. © XenosFinance